Background and Motivation
In today's day and age of Twitter, popularity is measured in hearts, retweets, follows, and follow-backs. What posts get popular over time? What seems to resonate most with people? Do positive or negative sentiments invite more engagement? In this project, we use Twitter's publically available archive of content to like to examine some of the shared characteristics of popular posts, including length of post, visual content, positivity, negativity.
Our idea came from a desire to understand what makes a post popular. Twitter itself has published research on What fuels a Tweet’s engagement? Their research found that adding video, links and photos all result in an increase in the number of retweets and even breaking down those results by industry. Inspired by previous research, we sought to include sentiment analysis in our understanding of what made a Tweet popular.
Objectives
- How does the distribution of retweets and hearts vary for a post depending on the time of day when the tweet is created?
- How does positive and negative sentiment affect popularity?
- What Tweets do we think will become popular?
Approach
Twitter is a social network, real-time news media service, and micro-blogging service where users can use text, photos, and videos to express moments or ideas in 140-characters or less. These 140-character messages are called "tweets.” According to Twitter’s website, millions of tweets are shared in real time, every day. This data is publicly available via the Twitter Static API
After scraping tweets from the Twitter Streaming API, we used that data to conduct a series of exploratory analyses on features that we thought intuitively would contribute to the popularity of a tweet. These explorations revealed patterns about how user mentions, follower count, urls, hashtags, post times, and tweet sentiment could interact with a tweet's popularity score. Popularity score was a the transformed values of the total number of retweets and favorites that a tweet received. When looking at retweets, we made sure to go back to the original tweet, and for that matter, we made sure not to consider the same tweet twice. The findings from the exploration phase informed the creation of our predictive algorithm using ordinary least squares.
Exploratory Analysis
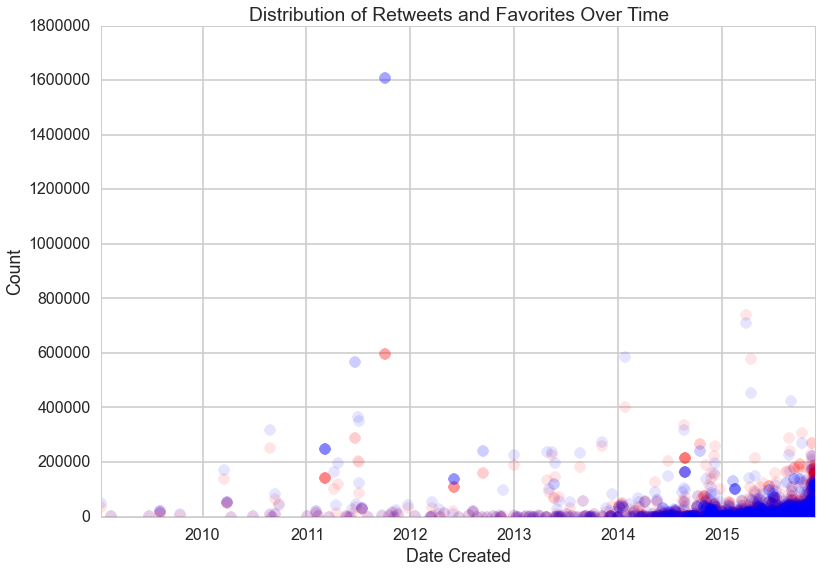
The distribution of retweets and favorites over time
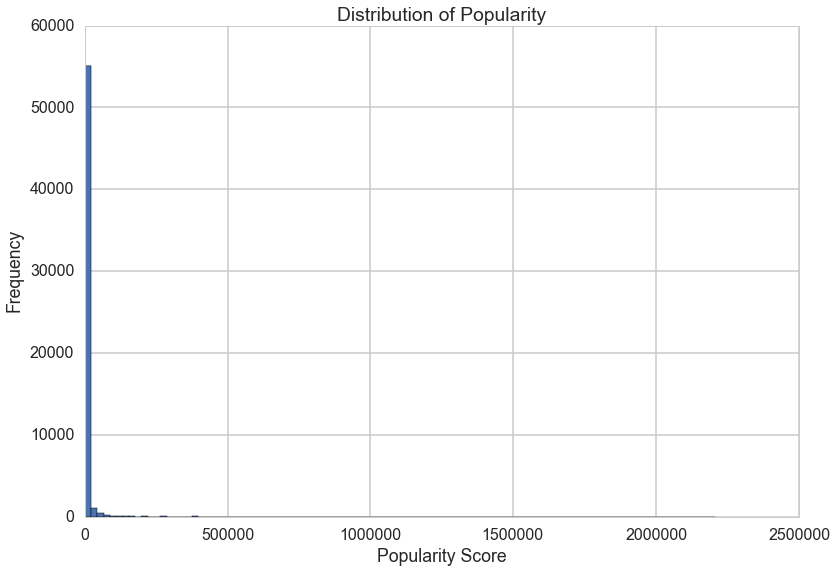
Popularity Score
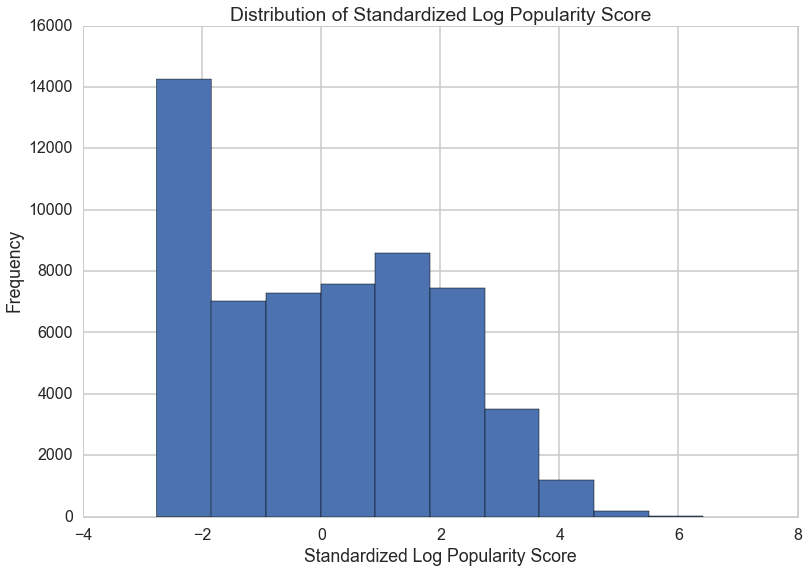
This is the response variable that we are trying to predict using various features of a tweet. The score was originally calculated by adding raw retweet count and favorite counts together, but after some exploratory analysis we chose to take a log transformation and standardize retweet and favorite counts. This is the value that we are trying to predict in our model
Before Transformation
After Transformation
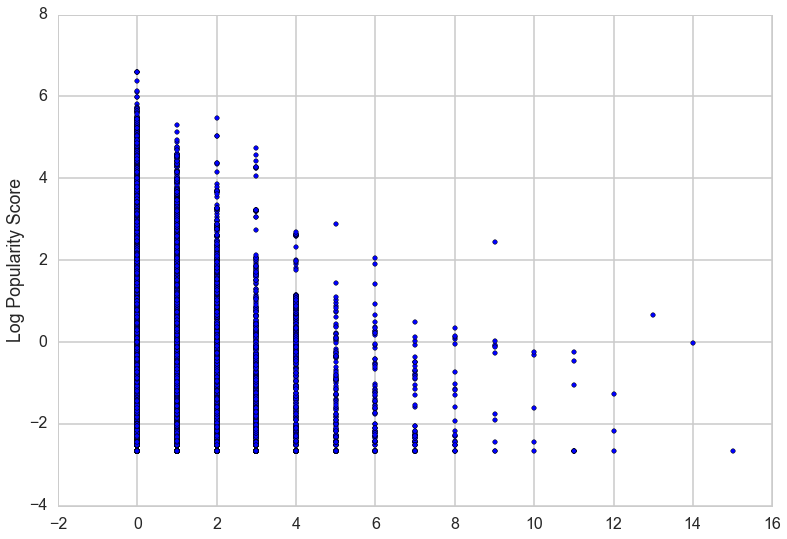
Hashtag Analysis
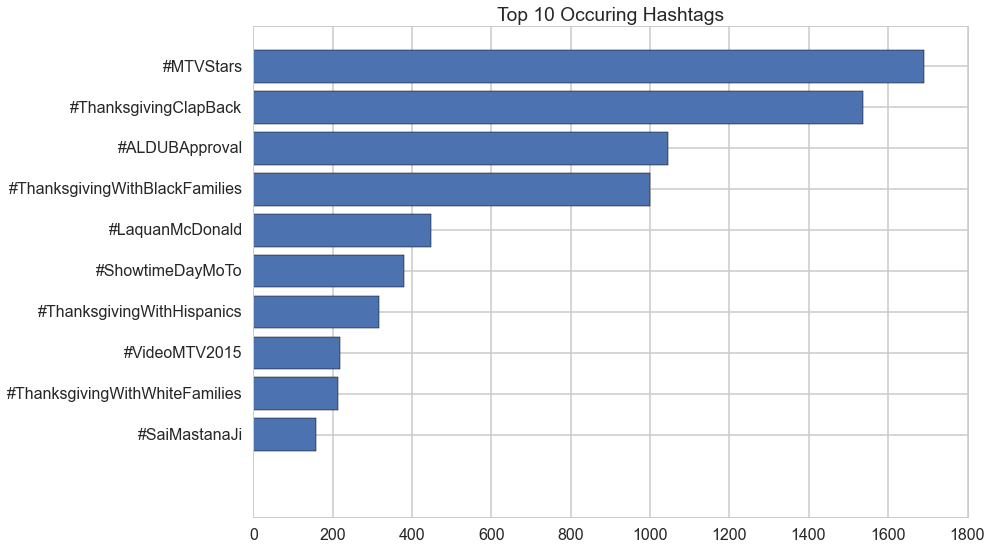
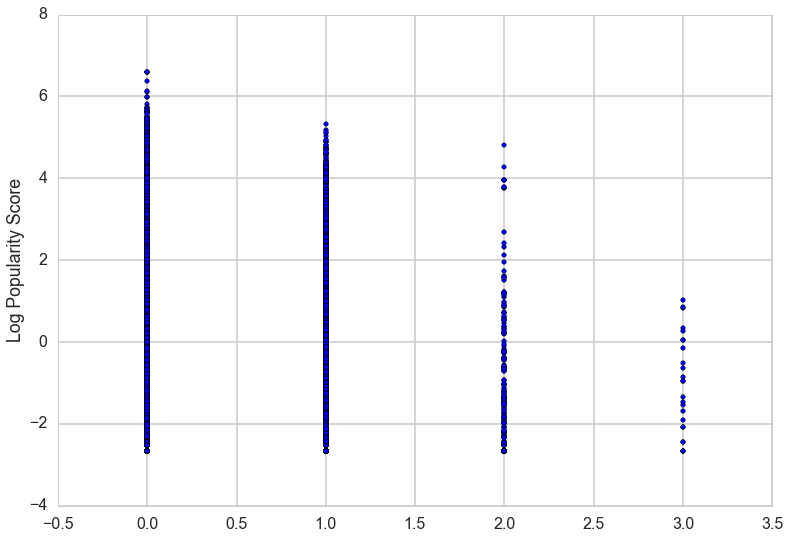
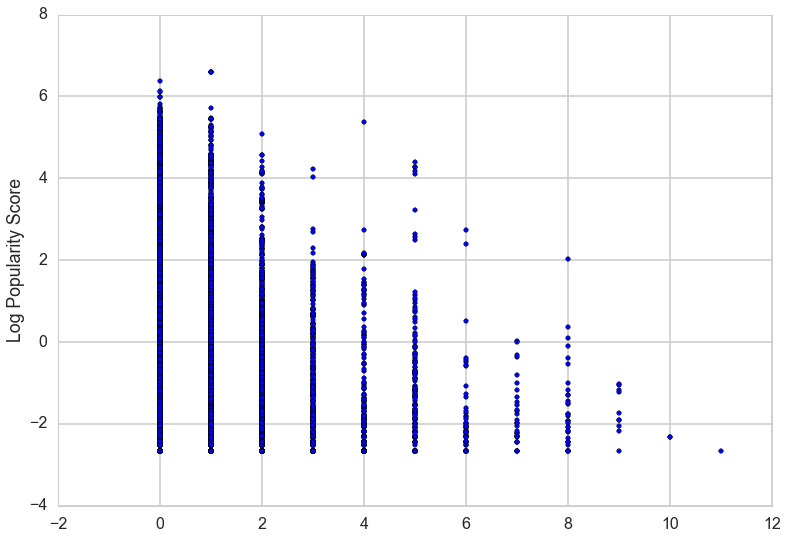
We found that approximatly a quarter of the tweets in our sample included one or more hashtags, with up to 16 hashtags used in a single tweet! We took the top 10 most commonly used hashtags to mean the most popular topics of our sample, and included the top four hashtags in our model. In addition, having a large amount of hashtags didn't necessary mean having a more popular tweet!
Number of Hashtags vs. Popularity Score
Top 10 hashtags
Correlation between presence of links and popularity
Correlation between user mentions and popularity
It appears as though increasing the number of user mentions is correlated with a decrease in popularity score.
Post Time
When are tweets posted during the day?
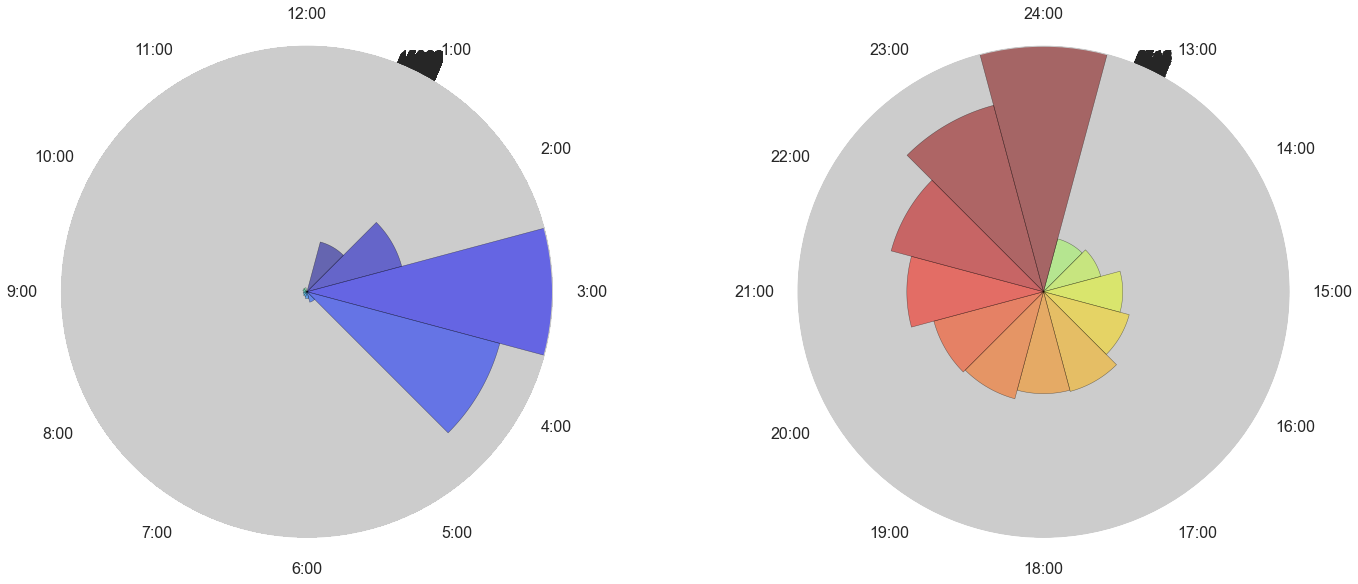
There does not appear to be a clear relationship between the time of day that a tweet is created and its popularity score, but we found there there did appear to be some cyclical change, so we chose to include this in the prediction model.
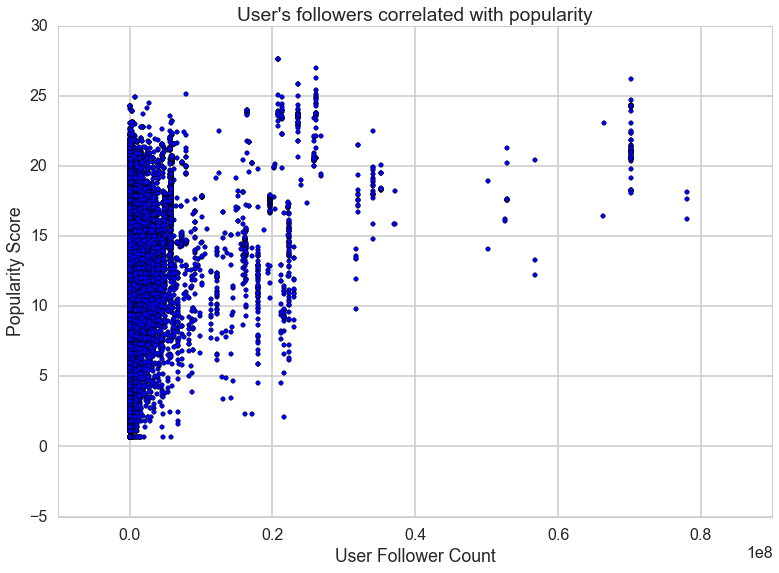
User's followers correlated with popularity
Sentiment Analysis
Using sentiment lookup dictionaries, we scored tweets based on how positive/negative they were on a continuous scale. Due to the nature of Twitter, many words and phrases tweeted were not in standard English and did not appear in our dictionaries. We chose to go with LabMT as our dictionary since it was built for Twitter and therefore contained more words that we looked up. We used NLTK to handle much of the text parsing.
The Ngram Problem
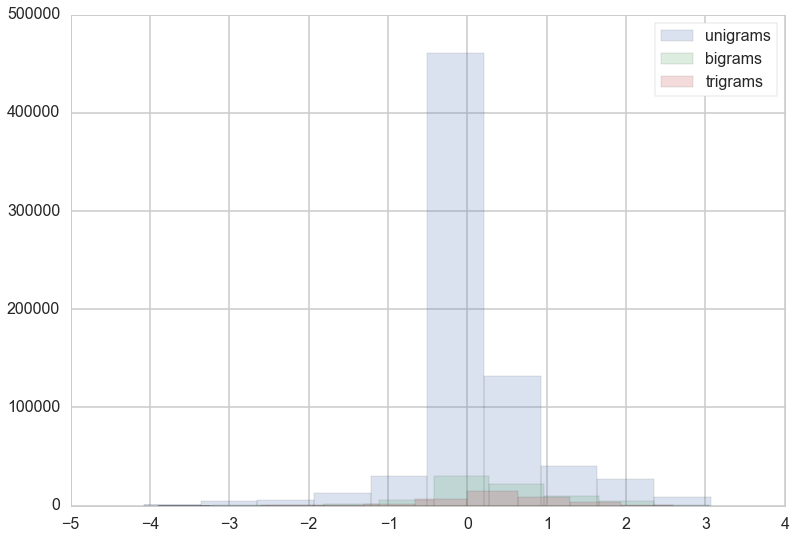
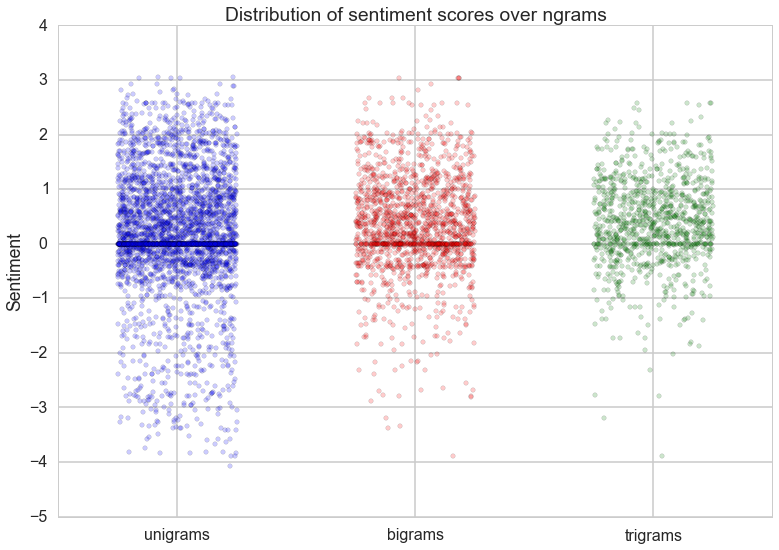
Our approach to sentiment analysis is very simplistic, in large part because we look at words individually. However, in sentences words are not independent of each other and their meanings can combine in different ways to affect the sentiment. For example, the phrase "not bad" would be considered positive, but our sentiment would score it as negative because "not" and "bad" are generally negative. To examine the extent of which this would affect our sentiment scoring, we looked at bigrams and trigrams to understand how often and which bigrams/trigrams could be scored differently than the unigrams. We found that it wasn't a significant enough difference to include them in our analysis.
Unigram, Bigram, Trigram comparison
Prediction
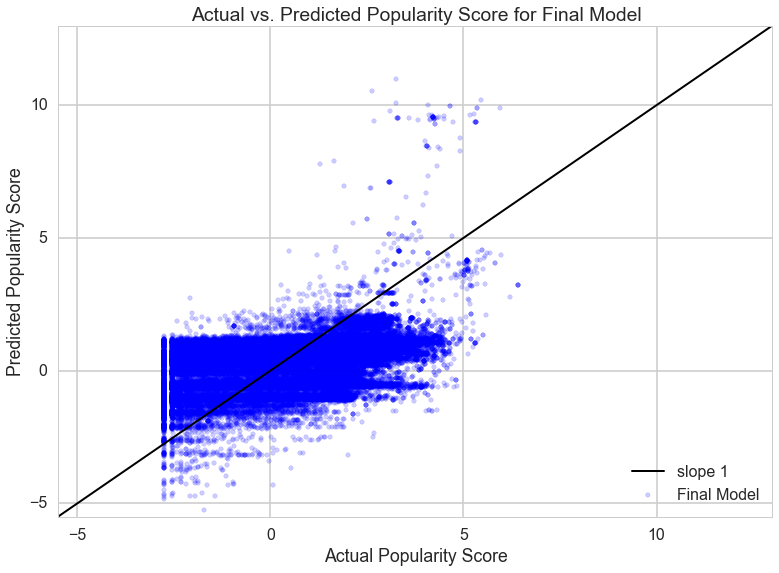
We modeled popularity as a function of features of the tweet and the user that posted it. Hashtags, links, mentioned users, sentiment, and time of posting are all features that can affect how many people see the tweet and the likelihood of a user retweeting and thus expanding the number of users who see the tweet. We also used the poster's follower count as a feature to account for users whose higher follower counts means that their initial audience is larger to begin with and can skew their popularity score compared to users with lower follower counts.
We were able to improve our prediction accuracy by adding in time posted as a feature and limiting the number of hashtags that we analyized to only the 4 most commonly occuring hashtags. However, our predictions often overprodicted the popularity of a tweet or were otherwise inaccurate.
Limitations
We have several limitations to this study.
- Data sample bias. Even though we scraped the tweets randomly, our sample is biased towards a specific time period, namely Tuesdays. This is because our tweets were originally scraped through the streaming API on a Tuesday. Though we filter the tweets looking for retweets and then only inputting the original tweet from that retweet into our data set, this causes a bias for our tweets to come primarily from Tuesdays, or even Monday and Wednesdays.
- outliers for max size
Future Work
-
Character Length and Emojiis, we didn't take out emojiis
-
We can also use 0 - inflated poisson
-
Naive Bayes Classifier
-
Time zone - seeing if local time vs universal time has an effect